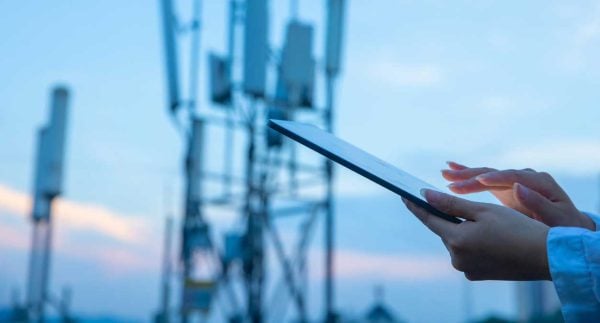
(Amounts in SEK million unless otherwise indicated) | ||||||||
2020 Jan-Mar Q1 |
2020 Apr-Jun Q2 |
2020 Jul-Sep Q3 |
2019 Jan-Mar Q1 |
2019 Apr-Jun Q2 |
2019 Jul-Sep Q3 |
2019 Okt-Dec Q4 |
2019 Jan-Dec Full-year |
|
Net sales by region | ||||||||
EMEA | 28.3 | 19.7 | 29.3 | 21.6 | 14.2 | 29.4 | 46.7 | 111.9 |
AMERICAS | 9.9 | 14.3 | 4.9 | 8.8 | 8.2 | 7.2 | 6.5 | 44.4 |
APAC | 3.2 | 4.6 | 3.7 | 22.6 | 8.5 | 6.5 | 4.2 | 28.0 |
Net sales | 41.4 | 38.6 | 37.9 | 53.0 | 30.8 | 43.1 | 57.4 | 184.4 |
Net sales by sales category | ||||||||
Products | 24.6 | 19.9 | 19.9 | 36.6 | 13.5 | 24 | 40.3 | 114.5 |
Services | 16.8 | 18.7 | 18.0 | 16.4 | 17.3 | 19 | 17.1 | 69.8 |
Of which: Support | 14.4 | 15.9 | 15.6 | 12.1 | 14.4 | 14.7 | 14.9 | 56.1 |
Of which: Professional Services | 2.4 | 2.8 | 2.4 | 4.3 | 2.9 | 4.3 | 2.2 | 13.7 |
Net sales | 41.4 | 38.6 | 37.9 | 53.0 | 30.8 | 43.1 | 57.4 | 184.4 |
Gross profit | 28.6 | 26.2 | 26.1 | 38.7 | 18.0 | 28.8 | 39.5 | 125.1 |
Gross margin. % | 69.0% | 67.8% | 69.0% | 73.0% | 58.5% | 66.9% | 68.8% | 67.8% |
Operating expenses | -34.3 | -38.2 | -24.0 | -39.5 | -39.3 | -32.4 | -39.1 | -150.3 |
Operating expenses/Net sales. % | 82.8% | -98.8% | -63.4% | -74.5% | -128.2% | -75.2% | -68.0% | -81.5% |
Operating profit (EBIT) **) | -5.7 | -11.9 | 2.1 | -0.7 | -21.3 | -3.6 | 0.4 | -25.2 |
Operating margin. % (EBIT) **) | -13.8% | -30.9% | 5.6% | -1.4% | -69.1% | -8.4% | 0.7% | -13.7% |
EBITDA **) | -0.5 | -7.0 | 7.3 | 4.7 | -16.3 | 1.1 | 5.5 | -5.2 |
EBITDA margin (%) **) | -1.2% | -18.2% | 19.3% | 8.7% | - 53.0% | 2.6% | 9.6% | -2.8% |
Profit for the period after tax | -6.9 | -11.6 | 2.4 | 0.4 | -16.4 | -2.4 | -6.1 | -24.5 |
Net margin. profit for the period. % | -16.7% | -30.1% | 6.3% | 0.7% | -53.1% | -5.5% | -10.7% | -13.3% |
Total assets | 281 | 263.5 | 253.0 | 310.4 | 303.0 | 282.3 | 289.4 | 289.4 |
Equity assignable to the parent company's shareholders | 205.5 | 193.8 | 195.4 | 238.2 | 221.8 | 218.0 | 212.6 | 212.6 |
Equity/assets ratio. % **) | 73.2% | 73.5% | 77.2% | 76.7% | 73.2% | 77.2% | 73.5% | 73.5% |
Return on equity (ROE) **) | -3.3% | -5.8% | 1.2% | 0.2% | -7.1% | -1.1% | -2.8% | -10.9% |
Return on operating capital (ROOC) **) | -3.5% | -7.9% | 1.4% | -0.4% | -12.0% | -2.2% | -0.3% | -14.0% |
Return on capital employed (ROCE) **) | -1.7% | -3.9% | 1.1% | 0.1% | -6.8% | -0.9% | 0.5% | -7.1% |
Cash flow from operating activities | 15.8 | 5.8 | -11.9 | 19.6 | -19.7 | 5.9 | -2.7 | 3.1 |
Cash flow for the period | 10.9 | 76.1 | -16.2 | 5.6 | -26.2 | 2 | -7.6 | -26.2 |
No. of employees at the end of the period* | 95 | 86 | 80 | 106 | 100 | 99 | 100 | 100 |
Whereof women | 12 | 10 | 8 | 14 | 14 | 14 | 13 | 13 |
*) Employees: Included in the number of employees at 30 June 2019 are 12 (16) consultants with employment-like agreements and seven persons in the newly acquired company, Cavena.
**) Financial measures not defined according to IFRS. Definitions of these measurements are presented here.